If you’ve been wondering how to set up the new Google Analytics version, GA4 for WordPress on your online business website, you’re in the right place. In this comprehensive guide, MemberPress Growth Manager Curt Noble shows you how to get it done fast, painless, and even for free.
This is not your average GA4 blog post or guide. I’m not going to spend a lot of time explaining what GA4 is and why it sucks.
I just want to show you how to set up GA4, and give you the information you need to do it, as quickly as possible.
Enough has been written about migrating from the previous version of Google Analytics, Universal Analytics (UA) to GA4. So, for this post, I’ll be showing you how to do a fresh install of GA4 on your online business site.
So, if you’re just getting started with WordPress and need to track your site visitors and performance metrics, bookmark this post.

Every Website Has Different GA4 Tracking Needs
Every website has unique data tracking needs. And it’s unreasonable to cover every single GA4 tracking scenario. So, I’m going to stick to the basics, as much as possible.
That means, if you want to know how many tacos your customers have eaten just prior to signing up for your Taco Tuesday Premium Recipe Membership… you’re in the wrong place.
Probably not going to outline that data tracking solution here.
But stick around, because you’ll need to start here anyway. The first step is to set up your GA4 account with Google and configure your data stream.
Sounds fun, right?
MemberPress is the Best Membership Plugin When it Comes to GA4 Reporting

All the methods shown in this guide work on any WordPress website. But let’s face it. Some WordPress plugins and themes just work better with GA4. And this is the case with membership sites.
The major advantage of MemberPress for integrating with GA4 is its flexibility, available hooks, and API access. It’s the easiest Membership plugin to integrate with.
This means that all the major Google Analytics plugins have integrated with MemberPress. You’ll see throughout this guide how these integrations make your life easier.
So, I’ll just come right out and say it. If you aren’t using MemberPress, you’re probably going to need a Google Analytics specialist to completely setup GA4 on your WordPress membership site.

Get MemberPress Today!
Start getting paid for the content you create.
How to Set Up Google Analytics GA4 on Your WordPress Membership Site

This guide covers four different methods for how to set up GA4 on WordPress for your membership site or online business. These methods range anywhere from easy to free, with the easy method requiring a small additional cost.
If you’re here looking for the best and easiest way to add complete Google Analytics GA4 tracking, I’ll give you a spoiler. The best way to add GA4 to WordPress is with MonsterInsights.
If you want to learn why that is, continue reading. If you just want to go with the best method, skip to the MonsterInsights section (Method 4 in this post).
I’m confident that one of these four methods will work for your situation. All four have the same first step. And you’ll need to start there before doing anything else.
Set Up a Google Analytics Account
If you’re not already signed up for any Google services (like Gmail or Google Drive), or you’d like to use a separate account for Google Analytics, you’ll first need to create a Google account.
So if you need to create an account, you can sign up for one on the Google Analytics webpage.
Create a New GA4 Property
After registering for your Google Analytics account and logging in, you’ll need to create your GA4 property.
Since one Google Analytics account can be used to monitor and analyze multiple websites, you can create multiple properties here to keep the data separate.
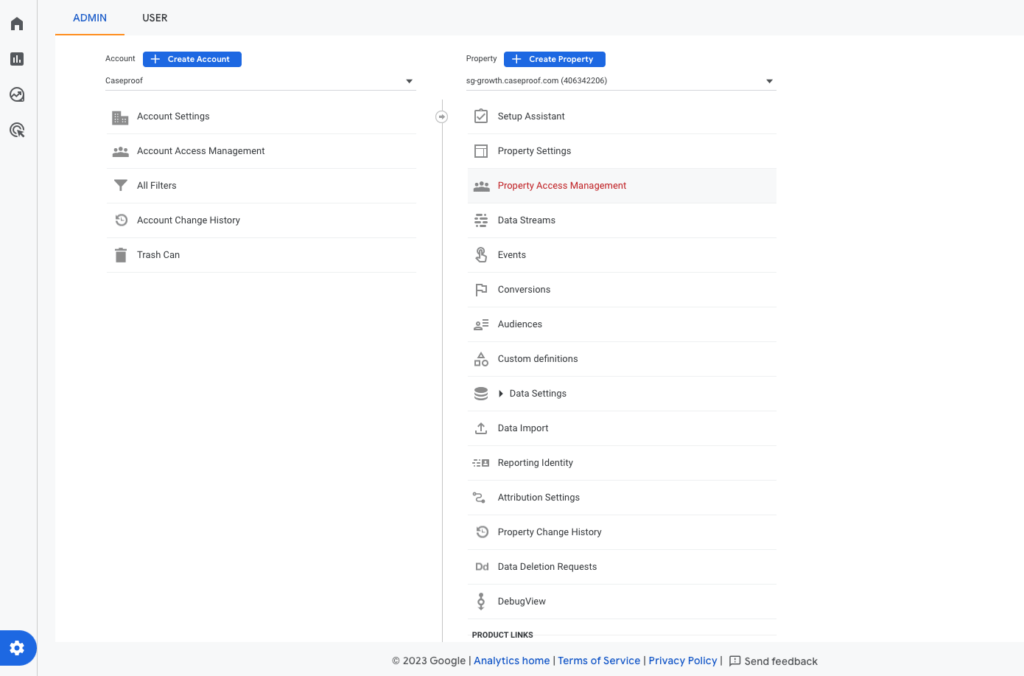
While logged into Google Analytics, click on the Admin item in the bottom left-hand corner. Then click the button to Create Property.
On the Create Property screen, you’ll just need to enter a bit of basic info about your website. Under the Business Objectives options you can select multiple objectives.
These settings determine which reports you’ll see out-of-the-box in GA4. Don’t worry though. You can always customize your GA4 reports in the interface later.
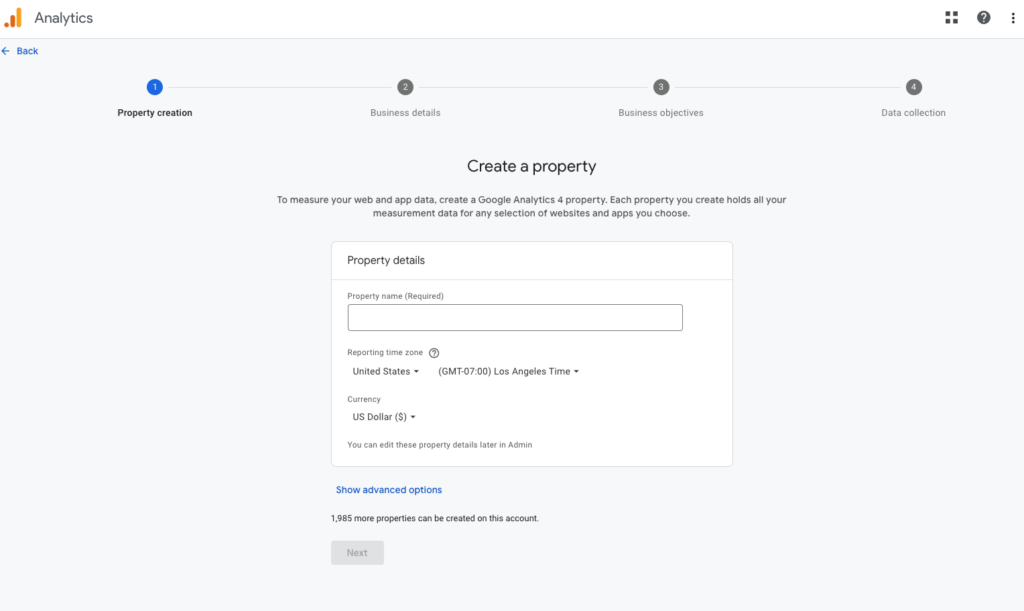
When you get to the Data Collection options, choose Web from the list. This is where you’ll configure your GA4 Data Stream.
The Data Stream is where GA4 collects all the events that happen on your website.
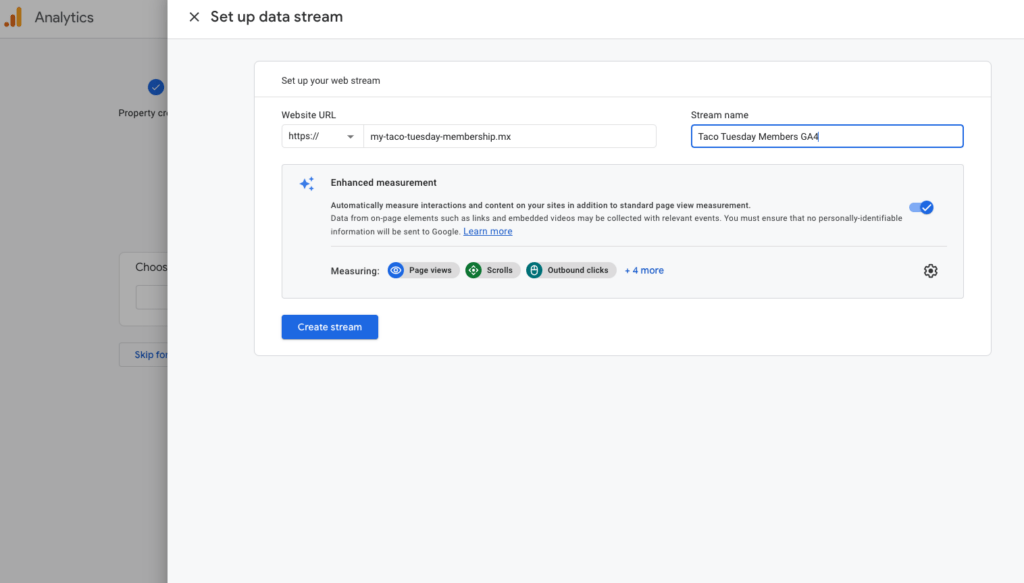
Enter your website URL and give your data stream a name. I recommend including “GA4” in the stream name. This will help you easily identify it as the GA4 data stream later on in this guide.
Configuring GA4 Events to Collect on WordPress
GA4 collects what are called default events. And you can choose which of these events are important to you.
I recommend selecting the Enhanced Measurement option. Doing so tells GA4 to collect a few more standard events, like scroll depth, outbound clicks, site search, and more.
If you click the gear icon to the right you can pick and choose which events to track. Your best bet is to leave them all checked.
Now, you might notice a glaring omission here – there’s no purchase event available! Weird, right?
More on that later.
Step One is Complete!
That wasn’t so hard was it?
So, now you have a fully functioning GA4 web property and data stream. But it’s just sitting there waiting for data to flow (kind of like my kid sitting at the table with a bowl waiting for someone to pour the Cap’n Crunch).
Next let’s look at four different ways to get cereal into the bowl. Errr… I mean get the GA4 events into the data stream.
Adding GA4 to Any WordPress Site
You’ve got your GA4 data stream configured and ready to receive website events. Now you just need to add some code to WordPress to send data into the stream.
I mentioned earlier that there are a number of ways to do this. And you’ll have to determine which is the best method for you based on your situation.
Here are a few things to think about when figuring out the best way to add GA4 to your WordPress site:
- How comfortable are you analyzing data within the GA4 reporting interface?
- Do you sell memberships, courses, or downloads on your website?
- Are you familiar with Google Tag Manager?
- Do you also have paid ads or social traffic you need to track?
- Do you have affiliate links you want to promote?
There are probably more things to think about here. But this is a good list to start with. Under each of the four methods below, I’ll also include scenarios showing when each method might be appropriate.
So let’s get to it!
METHOD #1: Add GA4 to WordPress free with Google Site Kit plugin
This method is completely free. But it may not be the best solution for your WordPress website. This solution works for WordPress membership sites that aren’t selling anything.
The reason is Google Site Kit has a major limitation when it comes to ecommerce tracking – that is, it doesn’t have it.
And it can only configure Google tools and solutions.
Think you might want to track affiliate links or traffic from social networks like Facebook or Twitter (X) sometime in the future? You’ll want to skip this free method.
When you decide to scale, this method will leave you too limited. That being said, here are the steps.
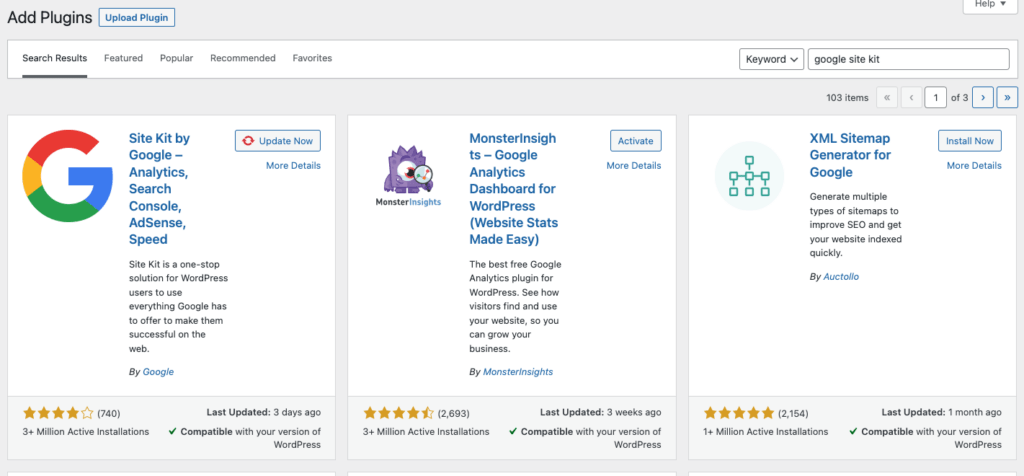
Install Google Site Kit Plugin
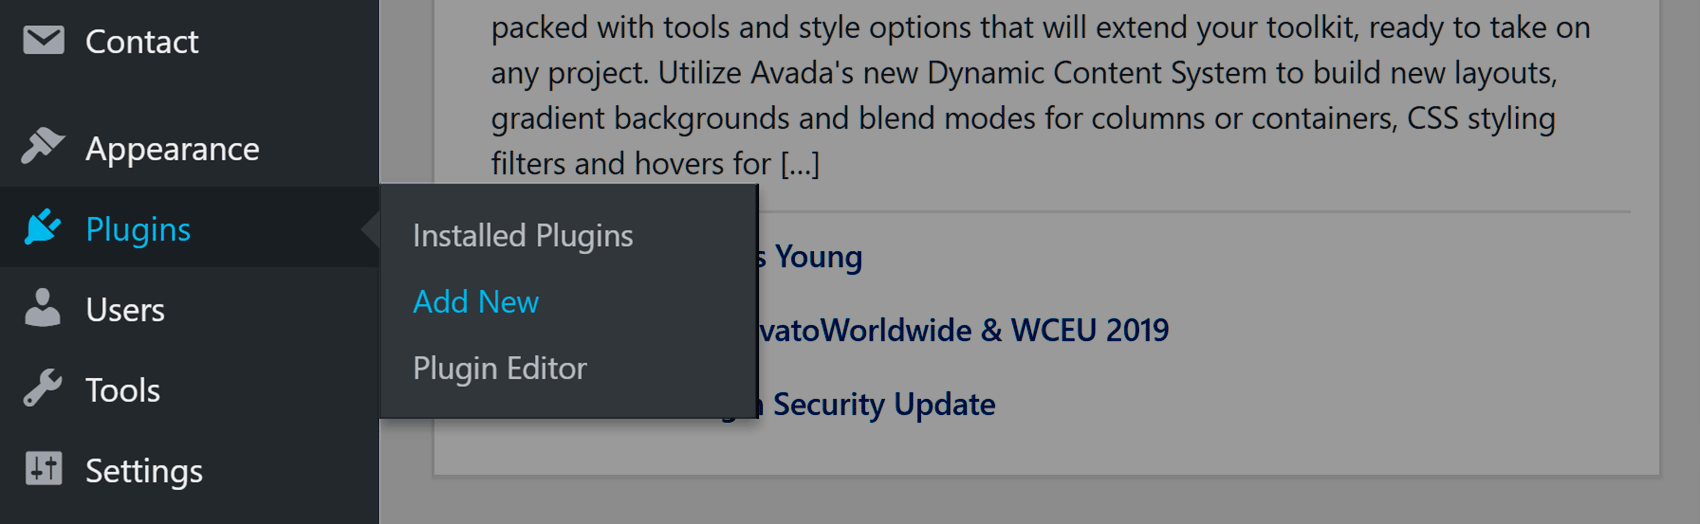
From the Add Plugins page, just search for the keywords Site Kit by Google. Then install and activate the plugin.
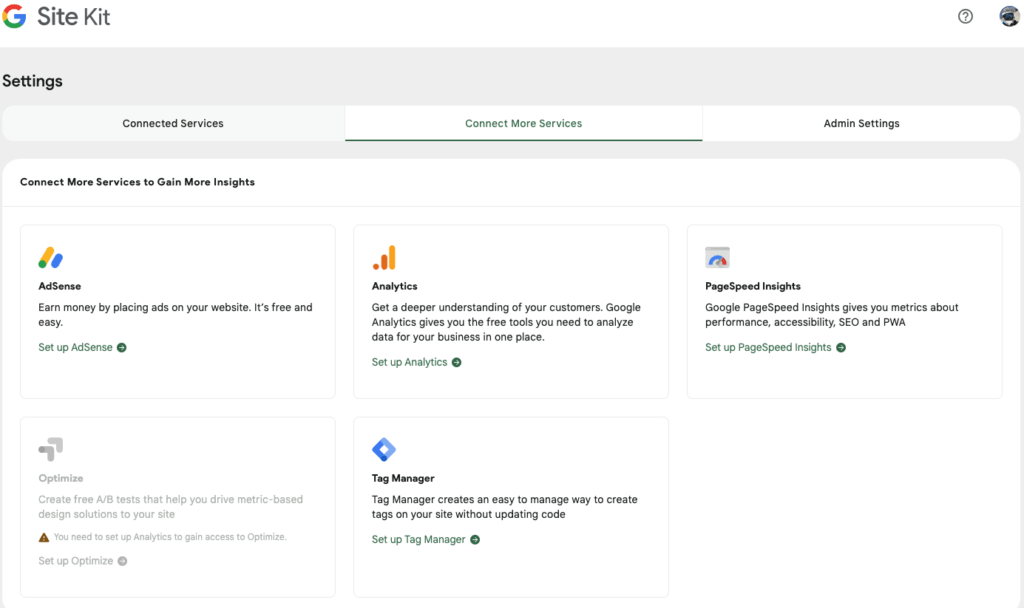
Once the plugin is activated, you can begin the setup process. The first step requires you to connect to the same Google account you used to create the GA4 property earlier.
Connect Your GA4 Data Stream to WordPress with Google Site Kit
I mentioned earlier that you can use Site Kit to connect to other Google tools and services. However, this is optional.
Right now, let’s just connect Google Analytics by selecting it from the list to begin setup.
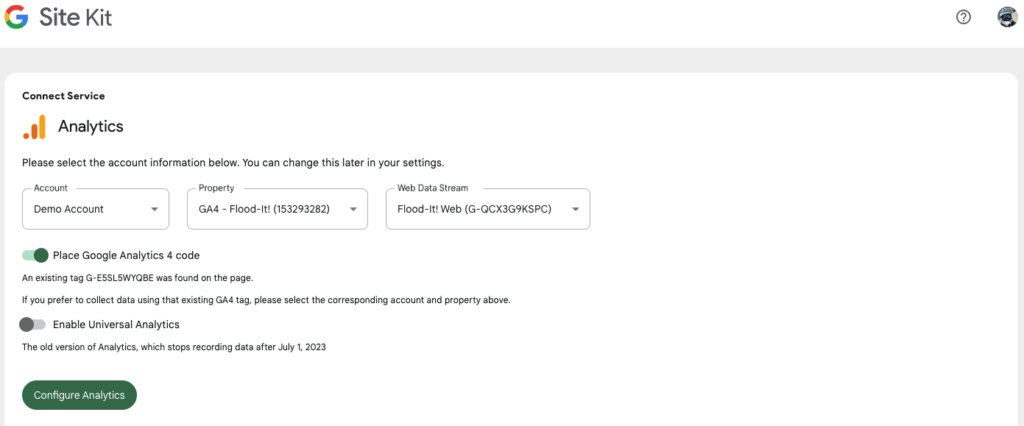
Next you’ll need to select your account, property, and data stream. Be sure you select the GA4 data stream you’ve already created.
Or you could allow Google Site Kit to create a GA4 data stream for you if you don’t already have one. But the options are limited. This is why I recommend configuring the data stream separately.
Be sure to enable the option to Place Google Analytics 4 Code here. This is how GA4 will collect analytics events on your WordPress site.
And that’s it. Google Analytics 4 is now installed on your WordPress website.
Be aware there’s a slight delay in data collection. So, you won’t see any data in your GA4 reports for several hours.
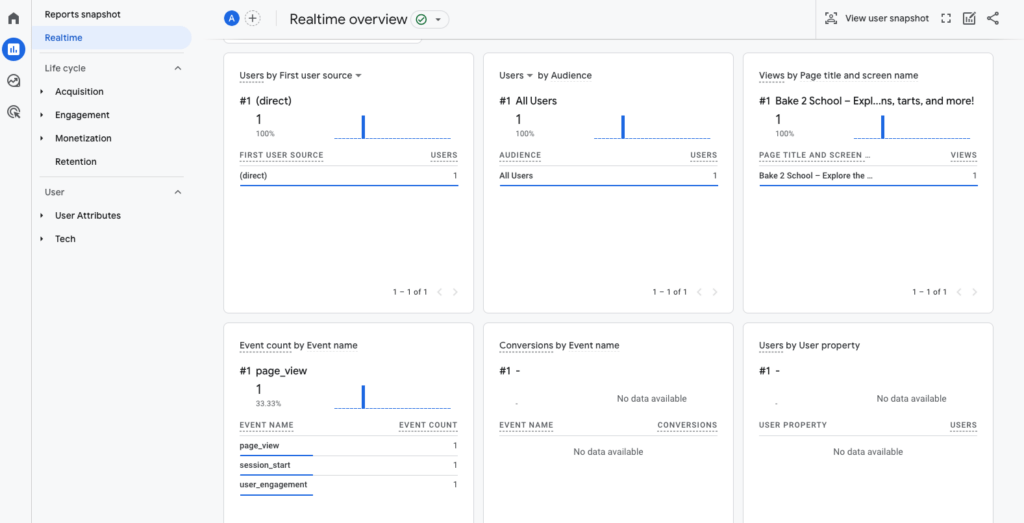
Validate that GA4 Data is Flowing
You can check to make sure your data is flowing by viewing the Real Time report in GA4.
Navigate back to your Google Analytics account, and select Reports on the left navigation menu. Then click Real Time.
If you don’t see any data here, it’s possible that no one is currently browsing your website. That’s okay. Just go to your website in another browser tab.
Shortly you should see that user session appear in the real time reports.
METHOD #2: Add GA4 to WordPress membership site with Google Tag Manager for free (kind of)
This next method for how to add GA4 to WordPress uses the free Google Tag Manager (GTM) solution.
While GTM is free, it may require an analytics specialist to complete a full setup. So this method works well for people who have previous experience with GTM.
GTM allows you to configure your own custom events. And with GA4, you’ll need to configure a lot of events in Tag Manager. So, buckle up.
To implement ecommerce tracking with GTM on a WordPress membership site, you’ll probably need some additional coding. Specifically, you’ll need a script that pushes your transaction data into the Google Analytics data layer.
Understanding the Data Layer
The data layer is a central concept when working with GTM and Google Analytics (GA4). It acts as a bridge between your website and GTM.
And it allows you to send custom data to GA4, Google Ads, and other third-party services.
The main purpose of the data layer is to separate the data from the presentation layer (your content). So, instead of hardcoding data directly into tags or scripts on your website, you can push the data into the data layer.
From there, GTM can read the data and use it to populate tags, triggers, and variables.
How a Data Layer Makes Your Life Easy
- Flexibility – You can easily add, modify, or remove data without changing the website’s code. This is especially useful for marketers who might not have direct access to a site’s source code.
- Consistency – By centralizing data in one place, you ensure consistent data collection across different tools and platforms.
- Enhanced Tracking – The data layer allows for more advanced tracking scenarios, such as capturing data from dynamic web pages or single-page applications.
- Security – By controlling what data goes into the data layer and how that data is accessed, you can ensure that sensitive information isn’t inadvertently sent to third-party tools.
Now that you’ve got the concept of the data layer, let’s get GTM installed!
Install a Google Tag Manager Plugin
There are a number of plugins that add GTM to your WordPress site. Since there is a standard GTM implementation, most of them do the same thing.
As it turns out, the Site Kit by Google plugin can also install a GTM container for you!
Scroll up to METHOD #1 to see how to install the Google Site Kit plugin. Then just choose the options to add Google Tag Manager.
Configuring the GA4 Tag in Google Tag Manager
With GTM installed and configured, you’re ready to deploy your first tag!
Quick note here: Google recently migrated the old GA4 Configuration Tag to the global Google Tag. So, if you’ve seen other tutorials mentioning a GA4 Configuration tag in GTM, it’s not there anymore.
Once you login to your GTM workspace, click to add a new tag. Then give the tag a name in the upper left.
I suggest using something like “Google Tag for GA4”. This will help you remember the tag is controlling your GA4 implementation.
Next, click into the Tag Configuration area to add a new tag type. You’ll see an option for Google Analytics. And on the next screen you’ll see several Google Analytics options. Be sure to select Google Tag here.
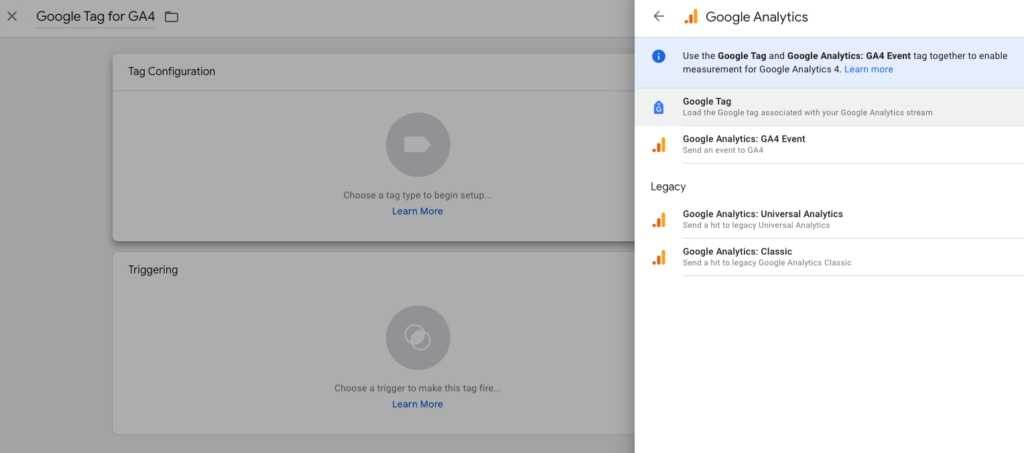
You’ll configure GA4 events later. First we need to get the Google Analytics code firing.
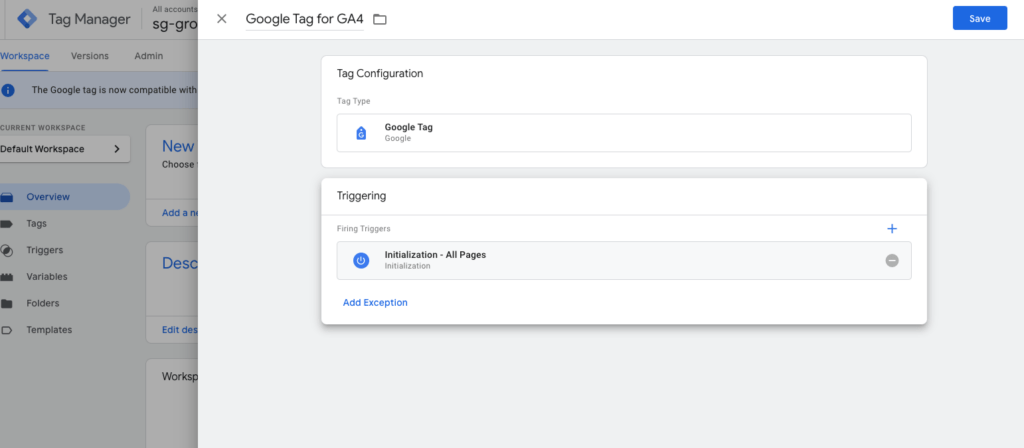
After you’ve added the correct Google Tag, you’ll need to enter your Google Analytics Measurement ID.
The tag ID is how Google knows where to send data collected on your website. Here is how you can find your GA4 Measurement ID.
Now we need to tell Google Tag Manager where you want this tag to appear on your WordPress site. The GTM container is on every page of your site. So, here you can choose to load the GA4 tag on every page as well.
In the Triggering panel, choose the option for Initialization – All Pages.
Publishing Your GA4 Tag to Your WordPress Membership Site
The only thing left to do now is to save your tag configuration and publish the changes to your container.
You’ll see a Submit button in the upper righthand corner of your GTM Workspace.
Now GA4 is collecting the default event data on your site.
All the code is in place to push default event data into your data layer.
And the events you configured earlier in the GA4 data stream options are being tracked.
However, there’s still no ecommerce tracking in place. So let’s take care of that…
How to Track Your Membership Sales Revenue in GA4
Remember all that talk about the data layer above? In order to track membership sales revenue or other ecommerce data, you need to push that data into your data layer.
This involves a bit of extra coding. And you’ll want to reference the Google Documentation.
There are two components to this setup.
First, you’ll need to push the transaction details to your data layer after a successful sale. Here’s what a sample from the Google documentation of what this would look like for a typical ecommerce transaction:
window.dataLayer = window.dataLayer || [];
window.dataLayer.push({
  'event': 'purchase',
  'currency': 'USD', // use your currency
  'value': 100.00, // total transaction value
  'transaction_id': 'T12345', // unique transaction ID
  'items': [
    // array of purchased item objects
    {
      'item_id': 'SKU12345',
      'item_name': 'Product Name',
      'price': 50.00,
      'quantity': 2
    }
    // ... other purchased items
  ]
});
However, the MemberPress membership transaction data will look slightly different than this since the value for ‘item_name’ will be the name of your membership.
Here’s a MemberPress-specific PHP code snippet that will populate your data layer with the correct information:
<?php
/**
 * GA4 Enhanced Ecommerce Tracking for MemberPress
 * Fires on thank you page after successful transaction
 */
function echo_ga4_tracking_script() {
    // Check if membership parameter exists
    if (!isset($_GET['membership'])) {
        return;
    }

    // Get transaction based on available parameters
    $txn = null;
    if (isset($_GET['trans_num']) && !empty($_GET['trans_num'])) {
        $txn = MeprTransaction::get_one_by_trans_num($_GET['trans_num']);
    } elseif (isset($_GET['transaction_id']) && !empty($_GET['transaction_id'])) {
        $txn = MeprTransaction::get_one($_GET['transaction_id']);
    }

    // Validate transaction
    if (!$txn || !isset($txn->id) || $txn->id <= 0) {
        return;
    }

    // Get transaction details
    $total = $txn->total;
    $tax_amount = $txn->tax_amount;
    $product = $txn->product();
    $user = $txn->user();

    // Prepare item data
    $item_name = isset($product->post_title) ? $product->post_title : urldecode($_GET['membership']);
    $item_id = isset($product->ID) ? $product->ID : $txn->product_id;

    ?>
    <!-- GA4 Enhanced Ecommerce Purchase Event -->
    <script>
    (function() {
        // Ensure dataLayer exists
        window.dataLayer = window.dataLayer || [];

        // Push GA4 purchase event with enhanced ecommerce parameters
        window.dataLayer.push({
            event: 'purchase',
            ecommerce: {
                transaction_id: '<?php echo esc_js($txn->trans_num); ?>',
                value: <?php echo floatval($total); ?>,
                tax: <?php echo floatval($tax_amount); ?>,
                currency: 'USD',
                shipping: 0,
                items: [{
                    item_id: '<?php echo esc_js($item_id); ?>',
                    item_name: '<?php echo esc_js($item_name); ?>',
                    affiliation: '<?php echo esc_js(get_bloginfo('name')); ?>',
                    currency: 'USD',
                    discount: 0,
                    index: 0,
                    item_category: 'Membership',
                    item_category2: '<?php echo esc_js($product->post_type); ?>',
                    price: <?php echo floatval($total); ?>,
                    quantity: 1
                }],
                // Additional user data (optional)
                user_data: {
                    email_address: '<?php echo esc_js($user->user_email); ?>',
                    user_id: '<?php echo esc_js($user->ID); ?>'
                }
            }
        });

        // Optional: Log to console in development
        <?php if (defined('WP_DEBUG') && WP_DEBUG): ?>
        console.log('GA4 Purchase Event Fired:', {
            transaction_id: '<?php echo esc_js($txn->trans_num); ?>',
            value: <?php echo floatval($total); ?>,
            item_name: '<?php echo esc_js($item_name); ?>'
        });
        <?php endif; ?>
    })();
    </script>
    <?php
}

// Hook to wp_footer instead of wp_head
add_action('wp_footer', 'echo_ga4_tracking_script', 100);

/**
 * Optional: Add GA4 configuration script to head if not already present
 * Replace GA_MEASUREMENT_ID with your actual GA4 measurement ID
 */
function add_ga4_config_script() {
    ?>
    <!-- Google Analytics 4 -->
    <script async src="https://www.googletagmanager.com/gtag/js?id=GA_MEASUREMENT_ID"></script>
    <script>
        window.dataLayer = window.dataLayer || [];
        function gtag(){dataLayer.push(arguments);}
        gtag('js', new Date());
        gtag('config', 'GA_MEASUREMENT_ID', {
            'send_page_view': true,
            'enhanced_measurement': true
        });
    </script>
    <?php
}
// Uncomment the line below if you need to add the GA4 configuration script
// add_action('wp_head', 'add_ga4_config_script', 1);
There are a number of ways to add a custom code snippet to your WordPress site. We recommend the free version of WPCode to add code snippets.
Second, you’ll need to configure an event tag in GTM to collect and send the transaction data to GA4 reports. The tag setup in GTM look like this:
- Create a new tag with the tag type ‘GA4 Event’.
- For the event name, enter “purchase”.
- Map the event parameters like before:
currencyto {{currency}} Data Layer Variablevalueto {{value}} Data Layer Variabletransaction_idto {{transaction_id}} Data Layer Variableitemsto {{items}} Data Layer Variable
- Set a trigger for this tag to fire on the order confirmation page or after a successful transaction.
Isn’t There an Easier Way?
Using GTM to add GA4 tracking to a WordPress site can be quite an undertaking.
The approach I’ve outlined above would get you the basic analytics tracking and ecommerce revenue reporting.
But consider that you’d need to go and configure every other data point that you’d need to track. And then consider the risk of what can happen when Google “flips the script” on you.
For example, the migration from GA3 (Universal Analytics) to GA4 created quite a shakeup for site owners and marketers.
If you’re managing the complete tracking strategy with GTM, then you’ve got to pay very close attention to changes. In many companies, this is a full time position.
So, is there an easier way? The answer is yes. There are actually two better ways to do all this using premium plugins.
The Most Budget-Friendly Ways to Setup GA4 for WordPress Membership Sites & Online Businesses
Phew! We made it through the hard part. If you’ve read through the previous two options for setting up GA4 on WordPress, you might be thinking this is above your pay grade. I assure you, it’s not. These next two options are “stupid-easy”.
I’ve spent over 10 years working with web analytics systems.
I’ve worked on implementations ranging from free Google Analytics Legacy versions, to enterprise solutions like Web Trends and Omniture SiteCatalyst (both before and after the Adobe acquisition).
And I’ve even worked with customer data platform solutions like Tealium to deploy analytics code. I was working with data layers before they were cool.
So, you can trust me when I say, the following two plugins are the best way to implement GA4 on WordPress.
METHOD #3: The “almost free” way to add GA4 to WordPress with WPCode Pro
When I was in college we had this discount card called the “Starving Student Card.” The card gave me sweet discounts on Big Juan Burritos at Taco Time. And I think there were other discounts too. But that’s not important.
Point is, I should call this the “Starving Student” method to add GA4 to your membership site.
It’s totally budget-friendly, even for a college student on a limited budget. Here’s what you do:
Sign Up For and Install WPCode Pro
There’s a free version as well, called WPCode Lite. But since you’re implementing GA4 on a membership site, you’ll need some key features only available in the Plus, Pro, or Elite plans.
Specifically, you’ll need the Conversion Pixels and 1-Click eCommerce Tracking features.
And bonus! You’ll also be able to use WPCode Pro to add your social media tracking pixels.
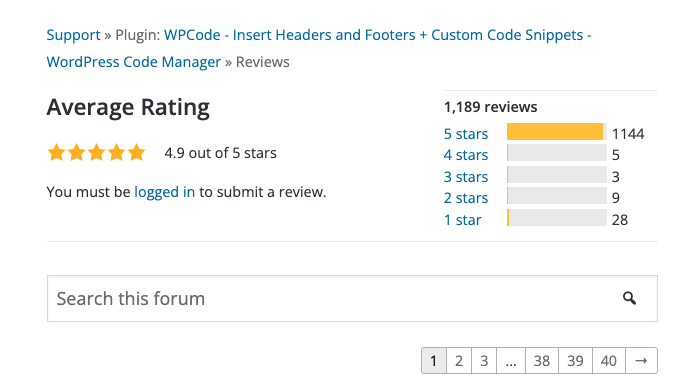
There are millions of WordPress websites using WPCode. And at 4.9 stars, it’s quite possibly the highest rated plugin out there.
So, as a first step, go sign up for WPCode Pro. (The WPCode Plus Plan will give you everything you need for GA4.)
Next, follow the instructions to install and activate the plugin on your WordPress website. WPCode Pro is integrated with MemberPress, and will auto-detect your MemberPress plugin. This is a major time saver.
Configuring WPCode Pro to Implement GA4 on Your WordPress Membership Site
You won’t need to add any additional scripts or code. WPCode Pro will set up and push ecommerce data to the data layer.
And you won’t need to configure anything in Google Tag Manager. In fact, WPCode completely eliminates the need to use Google Tag Manager on your WordPress site.
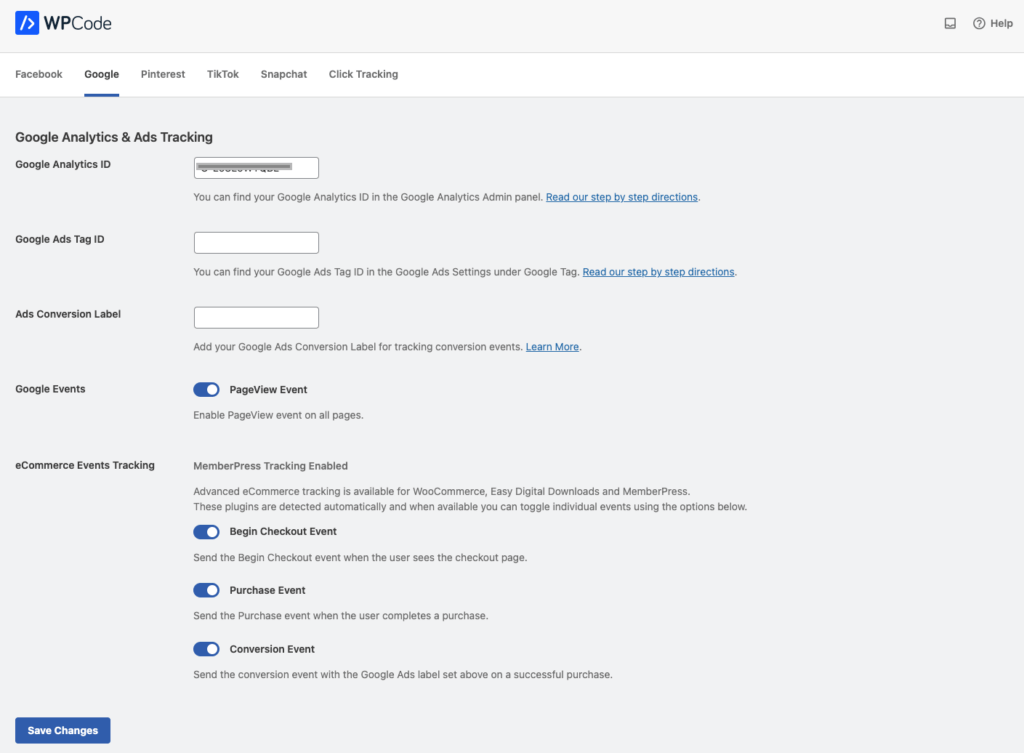
The only thing you need to do is tell WPCode Pro your GA4 measurement ID (in the blurred-out field below). The plugin handles the rest. Be sure to select which conversion events you want to track. I recommend tracking all the available events.
And that’s it. You’re done adding GA4 to your membership site. All your membership signups are being tracked, and the data is being sent to your GA4 reports.
At the end of this post, I’ll show you where to find your membership conversion data in GA4 reports. But first, I’ve got one more stupid-easy solution for you!
METHOD #4: The best way to add complete GA4 tracking to WordPress Membership Sites with MonsterInsights
One caveat to using WPCode (above) is that it sends all the data to your GA4 account. So, to see your data, you need to login to your GA4 account and find your way around that user interface.
And initial reports are in. The new GA4 user interface is, well… garbage, according to users.
This is why MonsterInsights is my preferred solution for a full-scale, complete GA4 install. With MonsterInsights you’ll be able to do the following, easily:
- Full-scale GA4 tracking, including ecommerce – No FOMO over not tagging or tracking something you might think of later
- See all your data right in your WordPress Admin – You won’t need to fumble around the terrible GA4 user interface to find critical insights in your data
- Outbound link tracking – You’ll know how many people are actually clicking on the links you include in your blog posts
- Affiliate link tracking – See which affiliate links are getting the most clicks
- EU compliance built-in – Sleep easy at night without a fear of a major fine from the EU for violating data privacy laws
- Logged-in user tracking – Analyze how your paid members are using your site differently than the general public
- Author tracking – Report on each blog author’s performance
- Zero-Code Implementation – No extra costs to configure your tracking code and event setup
That’s just a quick overview. There are so many features that make MonsterInsights an easy and affordable decision.
The zero-code aspect pays for itself instantly. You don’t need an analytics engineer or specialist with MonsterInsights.
Sign Up and Install MonsterInsights Pro for Less Than a Chipotle Burrito Each Month
To get the ecommerce reporting, you’ll want to sign up for the Pro license. When you break down the cost, it’s less than a Chipotle Burrito each month.
And the setup wizard makes the installation process quick and painless.

The wizard is thorough, and very intuitive. So, I won’t cover every step here.
But there’s a detailed guide for the complete setup process, if you need it. When you get to the addons step, make sure you install the MonsterInsights ecommerce addon.
That’s really all there is to the setup.
Your WordPress Membership site should now be all setup with GA4 tracking. MonsterInsights has created your data layer and all the GA4 events you chose to track earlier during setup.
As I mentioned above, you don’t even need to login to your GA4 account to see your data. MonsterInsights presents your data right in the admin area of WordPress.
Viewing Your GA4 Data in the WordPress Admin
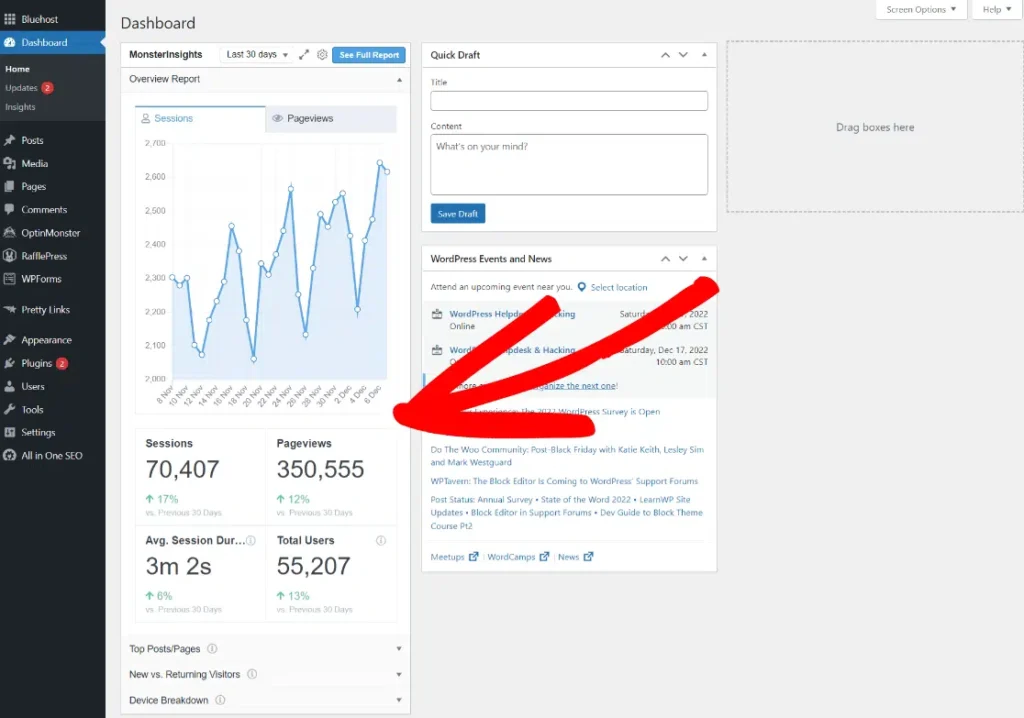
To get to your GA4 data in MonsterInsights, you’ll see a quick summary in the dashboard widget.
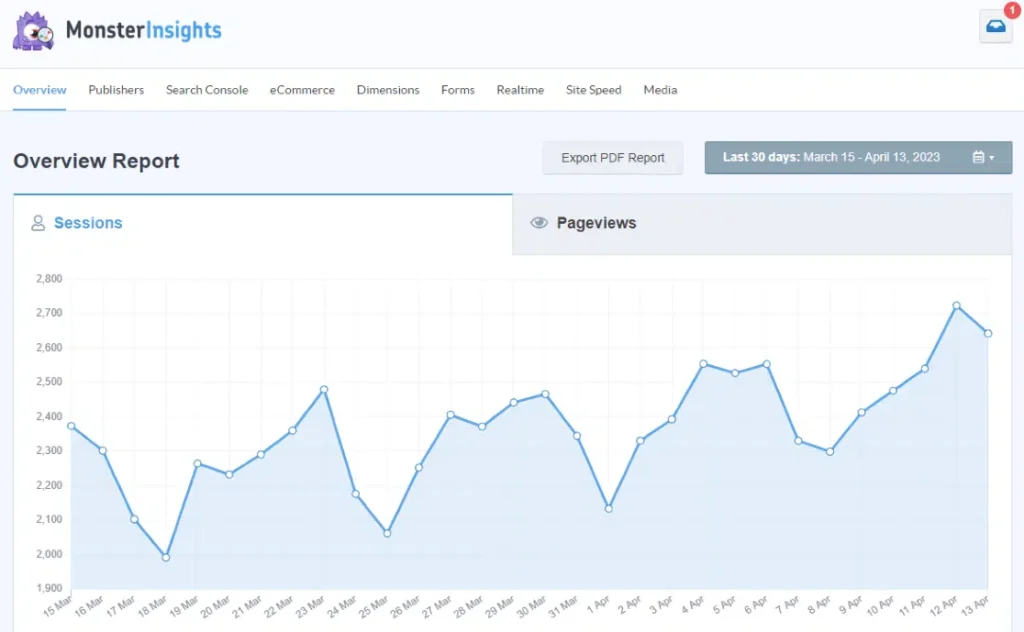
And you’ll see a full suite of reports by navigating to the Insights link in your left navigation.
Viewing Your Data in Google Analytics
Of all these options, only MonsterInsights will display your analytics data directly inside WordPress. For the other options, you’ll need to login to your Google Analytics account and navigate to your GA4 property.
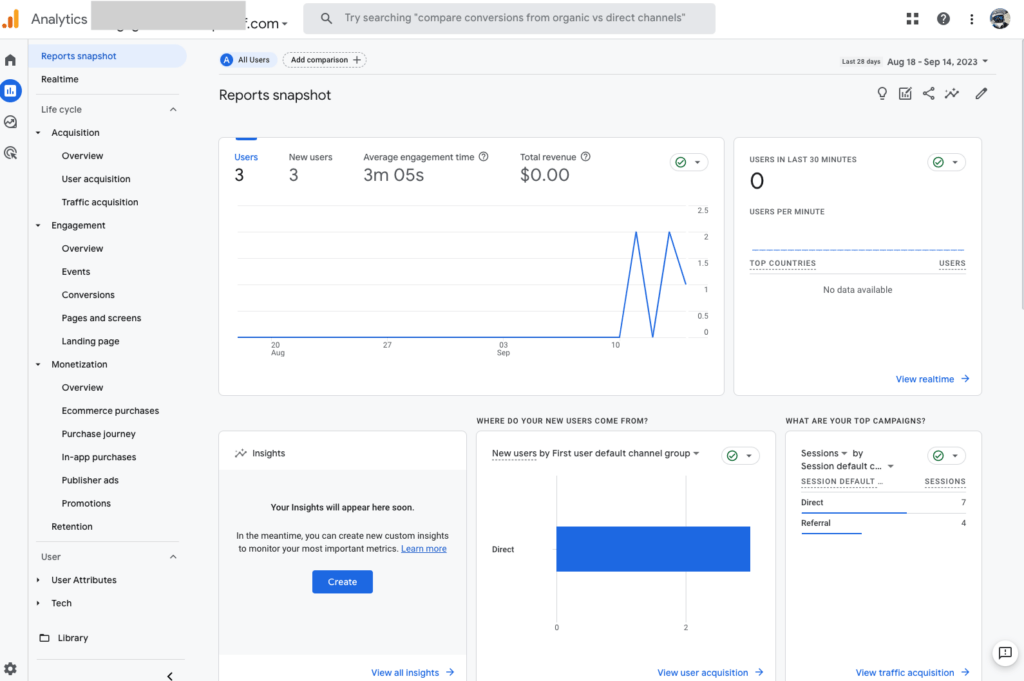
This screenshot is the result of the sandbox environment I was playing around with in this guide. So, there’s not a lot of data to show. If you’d like to get into GA4 and poke around a bit, I recommend accessing the GA4 Test Account.
Final Thoughts
Congrats! You’ve got Google Google Analytics set up on your WordPress membership site for your online business.
Now you can start to get a better understanding of your audience, how they’re interacting with your content, and how effective your site is at converting visitors into members.
If you’d like to know more about Google Analytics, we’ve published an article on how to use the service to optimize your membership site.
There’s also a free course on the Google Analytics website for those who really want to get the most out of this service.
Do you have any questions about using Google Analytics with your membership site? If so please, leave a comment below.


I’ve had an Analytics account for years, but Google seems to make it very difficult to navigate. I should have known that there would be a plugin to help me. (heh) Thanks for taking the time to write this article…it helps much.
Hey Joe, The informative you presented here was awesome. i want to say that you are a very good writer. Everything in this blog regarding google analytics is great… Thanks for sharing!!!
Refreshingly blunt! This GA4 guide cuts the fluff, diving straight into setup for WordPress newbies.
Love this feedback — thank you! We’re all about cutting the fluff and getting straight to the good stuff, so it’s great to hear that came through.